Single-concentration screening
Compare a candidate series in the same assay configuration and identify candidates for confirmation.
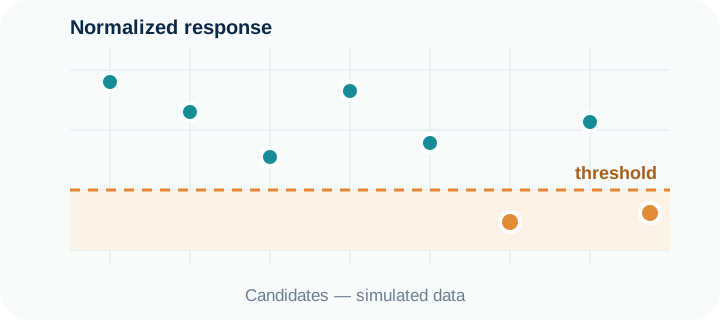

SYGPeD™ structures the readout around controls, a reference condition and quantitative comparison between candidates.
Compare a candidate series in the same assay configuration and identify candidates for confirmation.
Characterize selected candidates and estimate IC₅₀ when supported by design and quality criteria.
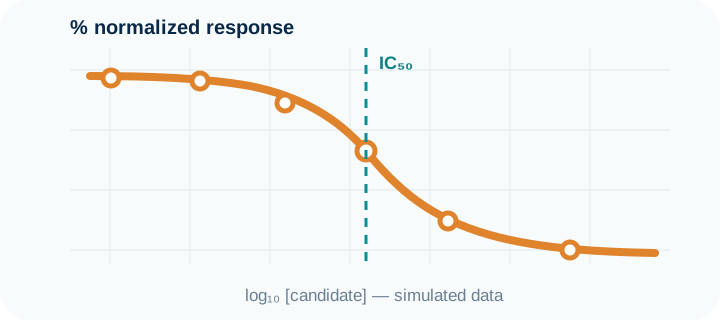
Conceptual illustrations; demonstration charts are not experimental data unless explicitly stated.
Performance level, readout type and acceptance criteria depend on the target and protocol. Project-specific data are documented within the study.
Establish the module signal in the selected assay configuration.
Measure signal change under comparable conditions.
Further characterize selected hits by dose-response or a complementary design.
PD‑1/PD‑L1 supports the primary immune-checkpoint positioning. HER2, EPO and several cytokine models have also been implemented experimentally to evaluate architecture modularity.
Reference immune-checkpoint module.
Experimental validation of a dedicated module.
Experimental validation of a dedicated module.
Several models investigated experimentally.
Protocols, experimental conditions and module-specific data can be discussed within an appropriate partner exchange.